"Having applied for a role via Reed, I was contacted by Simon the next day and had an interview and offer within a week. Simon provided a brilliant personal and thorough service and I would definitely recommend Aaron Wallis"
Alex Clegg

Average 2024 UK Salary Bonus
Page Overview:
At Aaron Wallis Sales Recruitment, we spotlight the state of bonus pay across the UK in 2024 to help you understand how incentive earnings stack up. This page reveals that the average full-time worker received just over £2,200 in bonus pay, set against an average gross income of £36,611, and highlights disparities by role type, age, gender, and region. You'll discover that corporate managers and directors top bonus earnings, while male employees typically out-earned female peers, and London-based workers earned significantly more. Use this insight to benchmark your incentive expectations with clarity and context.
Salary Bonuses in 2024 - How Does Your Bonus Stack Up?
In commission-based roles like sales or recruitment, bonus pay forms a key part of overall income. However, it's not just these roles which benefit from incentive pay as the majority of private sector jobs also include some sort of performance-based bonus. We've collated research from a series of datasets from the Office for National Statistics to discover the state of bonus pay in 2024 and how much incentive income the average UK earner could expect to be paid.
So, how much does the average UK earner take home each year as incentive pay?
The Average UK Bonus 2024: £2,242
ONS: Earnings and hours worked in the UK: 2024¹
In 2024, the average UK earner, working full-time (defined as working more than 30 paid hours per week), received a bonus of just over £2k. This figure includes earners who did not receive a bonus.
To put this into proportion, the average gross income (everything included) of a full-time UK worker in 2024 is £36,611.
What counts as incentive pay?
“Incentive pay is the amount paid to an employee as a result of meeting a performance or productivity objective, including profit sharing, bonus, piecework and commission payment” (Office for National Statistics). What's included in the data source?
The data from the ONS uses 1% of earners on PAYE tax taken from HM Revenue and Customs; in absolute terms, this works out as a sample size of around 300,000 UK earners.
Which jobs pay the highest bonuses?
Bonuses can be a controversial topic, particularly in the last 10 years following the banking crisis. Below is a breakdown of the average bonus by occupation:
| Occupation | Average Bonus | Jobs in the UK |
|---|---|---|
| Corporate Managers and Directors | £7,878 | 1,988,000 |
| Business, Media, and Public Service Professionals | £2,271 | 1,220,000 |
| Science, Research, Engineering, and Technology Professionals | £2,197 | 1,119,000 |
| Skilled Metal, Electrical, and Electronic Trades | £946 | 861,000 |
| Customer Service Occupations | £866 | 464,000 |
| Skilled Construction and Building Trades | £689 | 280,000 |
| Sales Occupations | £616 | 1,313,000 |
| Administrative Occupations | £582 | 2,040,000 |
| Process, Plan, and Machine Operatives | £531 | 1,356,000 |
| Leisure, Travel, and Related Personal Service Occupations | £519 | 331,000 |
| Transport and Mobile Machine Drivers and Operatives | £453 | 704,000 |
| Secretarial and Related Occupations | £415 | 530,000 |
| Elementary Trades and Related Occupations | £368 | 289,000 |
| Elementary Administration and Service Occupations | £232 | 1,992,000 |
| Health Professionals | £180 | 1,273,000 |
| Caring Personal Service Occupations | £37 | 1,721,000 |
ONS: Earnings and hours worked, occupation by two-digit SOC²
Unsurprisingly, and presumably due to dividend payments, corporate managers and directors take home the highest average annual bonus, with just under £8000. After this, professional services under business, media, public service and science tend to do well, averaging just over £2000 a year in incentive pay.
One limitation of the ONS data is that income is split by 'occupation' and can only be broken down into 2-digit SOC codes, rather than more common job title definitions; however, it still provides valuable insights into bonus pay in the UK by job type.
How much incentive pay can you expect for your age?
You would assume that the biggest bonuses would be received by seasoned professionals in the latter stages of their career; however, this isn't always true. Below is a breakdown of the average UK private sector bonus by age group:
| Age Group | Average Bonus | Jobs |
| 22 - 29 | £1,234 | 2,511,000 |
| 30 - 39 | £2,403 | 4,013,000 |
| 40 - 49 | £2,879 | 4,151,000 |
| 50 - 59 | £2,473 | 3,814,000 |
| 60+ | £1,252 | 1,106,000 |
ONS: Earnings and hours worked, age group³
The data suggests that after a decade or so of full-time working, incentive pay really starts to pick up. This is most likely the point where shares, share options, dividends and long-term incentive plans are likely to ‘kick in’ to supplement income.
Who earns higher bonuses: men or women?
The gender pay gap is a big discussion point in the UK today, and it looks to be just as much reflected in bonuses as it is in gross annual incentive income:
Average Male Bonus 2024: £2,613
Average Female Bonus 2024: £1,158
When broken down by both age and gender, the data points to the cause of the disparity; males between 40-59 tend to earn around twice as much incentive pay as females, taking home an average of £3500 per year:
| Age Group | Male Average Incentive Pay | Female Average Incentive Pay | Male vs Female Variance |
| 22- 29 | £1,503 | £885 | +£618 |
| 30 - 39 | £2,939 | £1,526 | +£1,413 |
| 40 - 49 | £3,703 | £1,552 | +£2,151 |
| 50 - 59 | £3,361 | £1,195 | +£2,166 |
| 60+ | £1,563 | £633 | +£930 |
| All | £2,614 | £1,158 | +£1,455 |
Which UK regions pay the highest bonuses?
Looking at purely private sector incentive pay broken down by region, jobs in London and the South East on average pay significantly higher bonuses than other regions in the UK:
| Region | Average Bonus | Jobs |
| London | £6,912 | 3,339,000 |
| South East | £2,213 | 3,064,000 |
| East | £1,772 | 1,914,000 |
| North West | £1,627 | 2,353,000 |
| Scotland | £1,567 | 1,992,000 |
| West Midlands | £1,566 | 1,970,000 |
| South West | £1,489 | 1,813,000 |
| Yorkshire and The Humber | £1,450 | 1,802,000 |
| East Midlands | £1,424 | 1,515,000 |
| Wales | £1,101 | 971,000 |
| North East | Data not available | 859,000 |
ONS: Earnings and hours worked, public & private sector⁴
The data we've collated from the ONS suggests that London is effectively ‘another country’ when it comes to incentive pay in the UK.
With the volume and type of commerce in the capital, it's easy to see how the average bonus is so much higher than in other areas throughout the UK. Financial and property sectors thrive in London, likely accounting for a large amount of the incentive pay, which brings the average bonus pay to nearly £7000.
Private sector bonuses over time
Looking at bonuses more generally, it's interesting to see how incentive pay has evolved over the last 15 years. The graph below breaks down the average private sector incentive income by year:
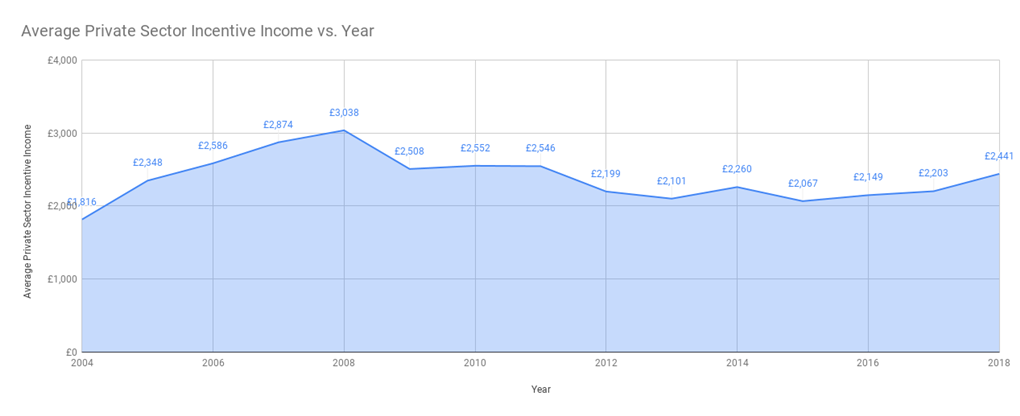
ONS: Earnings and hours worked, public & private sector⁴
Interestingly, bonuses have yet to recover from the 2008 recession, having peaked at £3,038. In 2024, the average private sector bonus was around £600 lower than this - perhaps caused by the negative connotations of 'banker bonuses' in the context of the financial crisis, which has likely reduced the massive bonuses at the top end of the scale.
Sales staff bonuses over time
As a specialist sales recruitment agency, we were particularly interested in how sales professional's incentive pay has evolved over the same time period, which can be seen from the graph below:
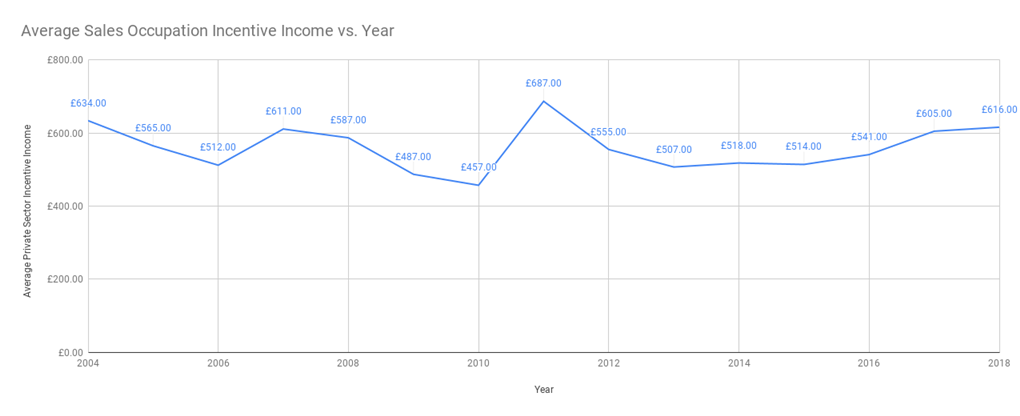
ONS: Earnings and hours worked, occupation by two-digit SOC²
Sales bonuses over the last 15 years peaked in 2011, and the reason for this isn't clear. However, we suggest that sales targets were reduced during the 'lean times' of 2009 to 2010 and were still at an artificially lower rate in 2011 despite the UK formally coming out of recession.
This could then be the reason why sales incentive pay slumped another 25% in the next two years, down to £507 in 2013, as sales targets were raised to the pre-recession levels. Since 2013, the average incentive pay has steadily risen year-on-year but is yet to meet the heights of 2011.
How does the ONS Group's Sales Occupations?
The average bonus pay for an employee in a 'sales occupation' appears to be lower than you'd expect for the business professional in a selling role This is due to the way that the Office For National Statistics defines sales roles to include everything from market and street traders to B2B sales roles resulting in bringing the averages down Despite this, the trend is still interesting to examine.
Commentary
The trends in UK bonuses suggest that the highest amount of incentive pay comes from male workers in the capital during the latter stages of their careers. The regional difference within the UK for incentive pay is striking, where a full-time private sector worker in London receives, on average, over three times the bonus of all other regions in the UK.
With the gender pay gap currently being a big talking point in the UK, the difference in incentive pay between men and women only adds to this, with the average full-time working male taking home over double the bonus of a female.
The private sector still appears not to have fully recovered from the controversy surrounding bonuses in pre-recession Britain, with the average full-time earner in the private sector still taking home 20% less incentive pay in 2024 compared to 2008. One limitation of this study is that the highest bonuses will have skewed the data, where a large amount of incentive pay goes to the people at the top end of the scale: The Guardian recently reported that the average FTSE100 UK Chief Executive took home a stunning £3.9m in total income in 2024⁵.
Looking at the sales industry more closely, the recession also affected bonuses, with the average incentive pay falling 28% between 2008 and 2010. Since then, sales bonuses have looked more positive with steady year-on-year growth from 2012 to 2024; however, they are yet to meet the levels of 2011.
We welcome the use of our data in other studies or articles. Please reference Aaron Wallis Sales Recruitment and www.aaronwallis.co.uk as the author of the study.
References
1) Office for National Statistics: Earnings and hours worked in the UK: 2024
2) Office for National Statistics: Earnings and hours worked, occupation by two-digit SOC
3) Office for National Statistics: Earnings and hours worked, age group
4) Office for National Statistics: Earnings and hours worked, public and private sector
5) The Guardian: Top UK Bosses' Average Earnings Hit £3.9m
About The Research
Aaron Wallis Sales Recruitment has collated data from the Office for National Statistics, analysing and combining different datasets published between 2004 and 2024. Data has been collected from the ONS's Annual Survey of Hours and Earnings (ASHE), which for 2024 was published on the 25th October.
The Annual Survey of Hours and Earnings provides information about the levels, distribution and make-up of earnings and hours paid for employees within industries, occupations and regions in the UK.
Breakdowns are available by gender, full-time/part-time workers, as well as by geographies, industrial classification, occupational classification and age groups. These breakdowns are then available for a variety of variables, including gross annual income, gross annual incentive pay, as well as different time dimensions from months to hours worked.
With a sample size of 1% of earners on PAYE tax taken from HM Revenue and Customs (in real terms, around 300,000 people in the UK), the datasets from the ONS provide a valuable and statistically significant insight into the earnings of UK citizens.

Search jobs
With hundreds of jobs available, now is the time to look for your perfect position

by Rob Scott
Managing Director

About the author
Rob Scott