"Aaron Wallis Sales Recruitment are a very friendly and professional recruitment organisation who listen to your needs, work with you and act on your behalf"
Ray Hood

Rob Author Example
Regional Job Growth in the United Kingdom - 2018
2018 was an interesting year for the UK economy, experiencing GDP growth of 1.4%, down from 1.7% in 2017 and the slowest economic growth the country has seen since 2012.1
Despite this, other economic indicators show a healthy job market with unemployment falling in consecutive years since 2011 and another 427,000 jobs being created in the UK between 2017 and 2018.2
We’ve aggregated data from the Office for National Statistics alongside EMSI to provide a report into regional job growth in the United Kingdom in 2018.
Regional Job Growth – December 2018 vs 2017
| Location | Dec-17 Jobs |
Dec-18 Jobs |
Absolute Job Growth |
% Growth in Jobs |
|---|---|---|---|---|
| Yorkshire & The Humber | 2,718,000 | 2,814,000 | +96,000 | +3.5% |
| North West | 3,697,000 | 3,827,000 | +130,000 | +3.5% |
| South West | 2,922,000 | 2,976,000 | +54,000 | +1.8% |
| South East | 4,795,000 | 4,879,000 | +84,000 | +1.8% |
| East of England | 3,216,000 | 3,267,000 | +51,000 | +1.6% |
| West Midlands | 2,908,000 | 2,947,000 | +39,000 | +1.3% |
| London | 5,931,000 | 6,000,000 | +69,000 | +1.2% |
| Northern Ireland | 884,000 | 888,000 | +4,000 | +0.5% |
| North East | 1,204,000 | 1,196,000 | -8,000 | -0.7% |
| Wales | 1,458,000 | 1,446,000 | -12,000 | -0.8% |
| Scotland | 2,717,000 | 2,692,000 | -25,000 | -0.9% |
| East Midlands | 2,396,000 | 2,343,000 | -53,000 | -2.2% |
Source: Office for National Statistics – Workforce Jobs 20193
What counts as a ‘job’ in ONS data?
The total number of jobs worked in an area; filled positions worked by ages 16 and over, working more than one hour per week.
Significantly, the report reviews where a job is worked, rather than the host, home, location of the worker.
Yorkshire & The Humber and the North West clearly led regional job growth in 2018, with a 3.5% increase in the amount of jobs year-on-year. In contrast, the East Midlands saw a significant decrease in employment of 2.2% over 2018, by far the biggest decrease in the UK.
‘Absolute’ number of jobs by region in the UK
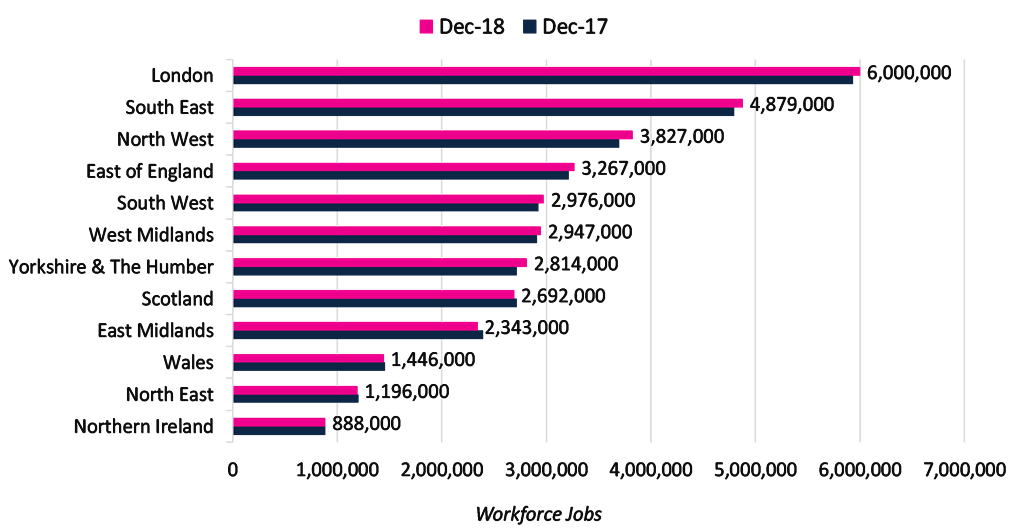
Looking in absolute terms, the South East and London remain by a significant margin the largest regions by workforce in the UK, with Northern Ireland and Wales both having a small count of employed workers for their geographic size.
Location breakdowns & commentary
North West - leader of regional job growth in 2018. +3.5%
ONS data suggests that over 130,000 jobs were created in the North West in 2018, by far the leader of absolute job growth in the UK. The surge in job creation has also had a positive effect on employment rate; at it’s highest since records began according to accountancy firm Deloitte.
Many are pointing to a ‘Manchester media boom’ as a key factor in growth, with regeneration of the Manchester Docks seeing considerable investment with the creation of an employment hub in MediaCityUK4. The relocation of thousands of jobs within the BBC to MediaCityUK, alongside the move of ITV Granada to Manchester has had a ripple effect with organisations both large and small moving to the North West.
Yorkshire & the Humber– joint leader of proportional job growth in 2018. +3.5%
With growth of nearly 100,000 jobs year-on-year, 2018 was a very successful year economically for Yorkshire and the Humber.
Leeds, in particular, can be seen as a growing economic hub, where between 2013 and 2018 the number of jobs has increased by 10%. EMSI industry reports attribute strong city growth in the following sectors, looking at industry jobs change between 2015 and 2018:
· Information & communications sectors, +19%
· Transportation & storage industries, +14%
· Construction activities, +14%
The growth of digital and creative agencies in Leeds, escaping the high rent costs of the capital are a key factor in the region’s growth.
East Midlands – largest decrease in jobs year-on-year. -2.2%
With a decrease in filled jobs of 53,000 in 2018 for the East Midlands, the region saw the biggest drop in workforce in the UK by a significant margin; over double the next net decrease in workers, Scotland.
Simon O’Neill, Managing Partner at EY in the Midlands, said: “The East Midlands is losing out to regions that have secured devolved powers from central government. Regions such as the West Midlands are showcasing how to make a success of devolution with GVA and employment performance above the UK average.”5
Employment growth is also forecasted to be slow or negative in 2019 and 2020, with the region lacking a growing employment hub with investment opportunities.
South East – good year-on-year job growth. +1.8%
Another year of positive job growth for the South East, where the ONS suggest that over 80,000 jobs were created in 2018. Outside of London, the South East is by far the largest economic hub with a workforce of nearly 5 million.
Economic success can be tied to great connections to commerce in the capital as well as a large number of aerospace and defence corporations in the territory.
Commentators point towards a ‘geographic imbalance’ in the UK, with criticism of policymakers for not addressing the gulf in economic disparity between the South East & London versus the North and regions outside of the core of the UK.6
Our report using ONS data would support this view, with over 30% of the UK workforce working in either London or the South East.
London – middling annual job growth. +1.2%
Over 2018, ONS data suggests the capital saw an increase in jobs of nearly 70,000: positive growth but not as high as the North West and Yorkshire and the Humber - in both absolute and relative terms.
Analysis from accountancy firm Ernst & Young points towards Brexit as a key factor in mixed job growth, with over 20 top financial services companies moving assets out of London7.
Despite this, London still by far has the largest regional workforce of nearly 6 million people; in context over 4 times the workforce of Wales.
Demand for top talent in the capital continues, with salaries and bonuses reflecting this. Our study into average bonus pay suggests that workers in London are likely to receive an average annual incentive pay over 3 times the national average.
To add to this, our study into regional sales earnings suggests that sales professionals in London are on average likely to receive a basic salary of 8% higher the national average.
About the data sources
ONS data source – the Office for National Statistics’ Workforce Jobs Survey is an aggregated report made up of:
- 32,800 business short term employer surveys
- A public sector employment survey with 1500 contributors
- The labour force survey of 50,000 households
With a total sample size of over 83,000 inputs the Workforce Jobs Survey is the largest of its kind: intended to be representative of the entire population of the UK.
EMSI data source – EMSI use a collection of nine Government sources, aggregated and combined to provide a multi-layered cross check, updated year by year to give over 20 million data points on labour market conditions in the British economy.
Other cited sources
- https://www.bbc.com/news/business-47196387
- https://www.ons.gov.uk/employmentandlabourmarket/peoplenotinwork/unemployment/timeseries/mgsx/lms
- https://www.ons.gov.uk/employmentandlabourmarket/peopleinwork/employmentandemployeetypes/bulletins/regionallabourmarket/september2018
- https://www2.deloitte.com/uk/en/pages/press-releases/articles/power-up-report-north-west.html
- https://www.eastmidlandsbusinesslink.co.uk/mag/news/east-midlands-economy-forecast-to-weaken-as-economic-report-predicts-slow-growth-across-the-uk/
- https://www.theguardian.com/uk-news/2019/may/30/half-of-job-growth-to-be-limited-to-london-inequality-inquiry-finds
- https://www.theguardian.com/business/2019/jan/07/city-firms-prepare-to-shift-800bn-out-of-uk-as-brexit-looms

Search jobs
With hundreds of jobs available, now is the time to look for your perfect position
Recruit sales staff
Just fill in your details below to get started